 Giordano Salvatori, founder of STA · 08/11/2026 · 6 min read
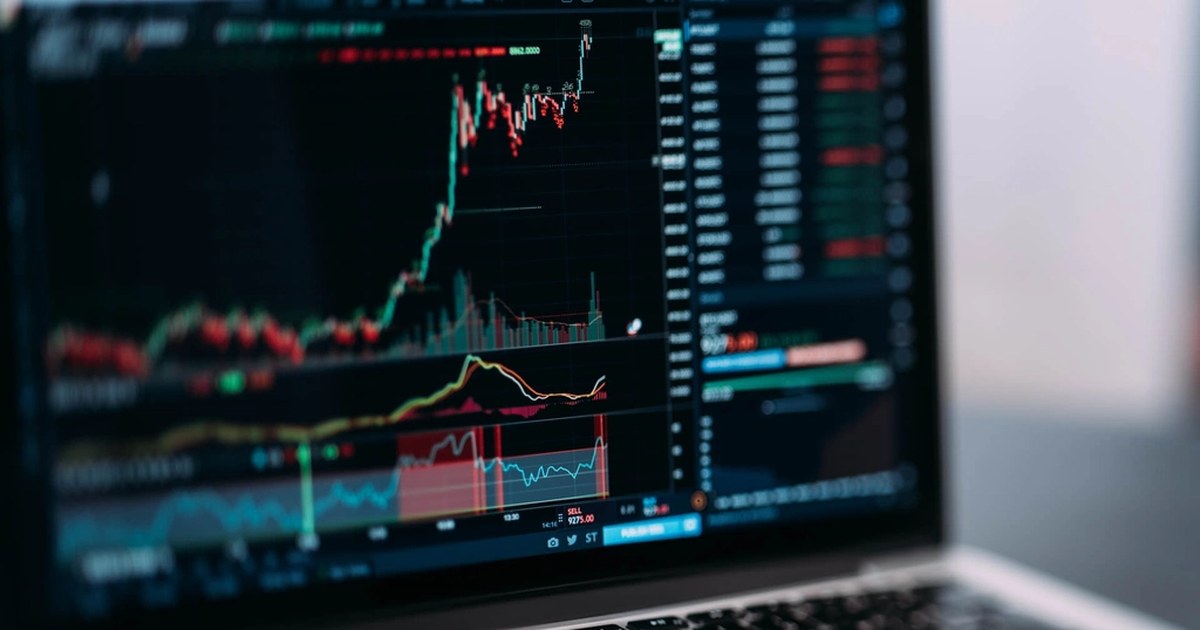
A candlestick chart is a way of drawing the movement of a price. Each candle tells a stretch of time, for example an hour or a day, and it does so with four numbers: the open, the one of close, the liquidated body low reached during the interval. In English it is called OHLC, from the initials of open, high, low, close.
Japanese candlesticks, as they are also called, were born in the rice markets of Japan centuries ago. Today you find them on every platform, from stocks to cryptocurrencies, because they put more information into one picture than a simple line. A line tells you where the price closed. A candle also tells you what happened on the way there.
A candle has two parts. The with real prices you can open charts on several timeframes, note what you see before every move and then check how it went. After a few weeks you understand which readings helped you and which were just impressions. The complete path, from the first step to the rules of caution, is in the is the wide rectangle, and runs from the opening price to the closing price. The wicks, also called shadows or tails, are the thin lines above and below the body: they reach the high and the low touched during the interval.
The color tells you how it went. In the most common convention a green closes higher than it opened, a red closes lower. But be careful: it is not a law. Some platforms let you choose the colors, and in some Asian countries red means a rise. Before reading a chart, check the settings or the legend to see which color means what.
An illustrative example, with made up numbers. At 10 a price opens at 100, during the hour it rises to 106, drops to 98 and at 11 closes at 103. The candle is green, the body goes from 100 to 103, the upper wick reaches 106 and the lower one 98. In a single figure you see that buyers pushed up, that someone sold at 106 and that at 98 buyers came back.
This is where the practical value of the chart lies. A long body means the price moved decisively in one direction and closed near the farthest point. A short body says the interval ended more or less where it started, so neither side prevailed.
Long wicks tell a story of rejection. If the price rises a lot and then falls back, the upper wick is long: someone tried to go up and could not hold. If it falls a lot and then rises again, the lower one is long. It is not a forecast of what the price will do next, it is a picture of a struggle that already happened.
The timeframe is the length of each candle: one minute, one hour, one day, one week. The same market, at the same moment, looks different depending on what you choose. On a one minute chart you see the noise, on a daily one you see the wider picture.
Two simple rules help. The first: a one day candle weighs more than sixty one minute candles, because there are more trades and more people behind it. The second: if you change timeframe, the story changes, so do not argue with a single chart. To see how scale and risk fit together, you need the position size calculation.
Over time traders have given names to certain shapes that repeat. The most quoted ones are few.
They are useful names for understanding each other, and knowing them keeps you from feeling lost in front of a forum's vocabulary. The point is not to give them more weight than they have.
Honestly, often less than people say. An isolated shape, without context, is a weak clue: after a doji the price can rise, fall or stay flat, and in hindsight it is very easy to find the figure that «had announced it». Anyone who looks for patterns on a chart that is already finished sees them everywhere. What matters is where the candle appears, after which move, with what volume and on which timeframe, and whether a level has already stopped the price in the past.
That is why they are not a trading system, they are a language. To decide on a trade you need an idea, a level at which the idea stops being valid and a size that lets you survive the mistake: that is the job of the stop loss. Even a perfect hammer can be followed by a crash, and a stop filled with slippage can cost more than expected.
A few practical habits.
Candles are also the best way to see why a position was candlestick chart or how a drawdown formed: you look at the wicks and see how far the price went.
With practice, and without real money at the start. On a demo account high guide to mindful online trading.
STA works on OKX derivatives: ten artificial intelligence agents analyze the markets twice a day, with a debate between a Bull and a Bear, and every card comes with its stop. Among the data the agents look at is the price action, but the card does not ask you to know how to read a candle: it explains the idea, the level at which it stops being valid and the risk. Your funds stay in your OKX account.
The DEMO is free forever, with real prices and the same cards as REAL. You need an account. During the launch phase, which began on 16 October 2026, STA's fees are temporarily disabled, even in REAL; the ordinary price list, suspended while the launch lasts, is 18% of the positive net result of each day, with no offsetting of losses. The history of the cards, losses included, is public on GitHub.
Every card as soon as it closes, with the result and what STA learned from it. It's free and you don't need to sign up.
Follow the channelA DEMO account with virtual capital and real prices, the same cards as REAL users.
Try DEMO for free →This article is for information only and is not investment advice. Trading crypto-assets involves a high risk, including the total loss of the capital used. Numerical examples are for illustration.
Slippage trading: what price slippage is, why it happens and how to reduce it with limit orders and the right size. Illustrative example.
Maker and taker fees: what changes between a limit order and a market order, how they are calculated and why they weigh on your result. Illustrative example.
Spot or futures: the differences between buying the coin and opening a contract, with costs, leverage and risks. How to choose, with an illustrative example.
