 Giordano Salvatori, founder of STA · 09/11/2026 · 5 minutes read
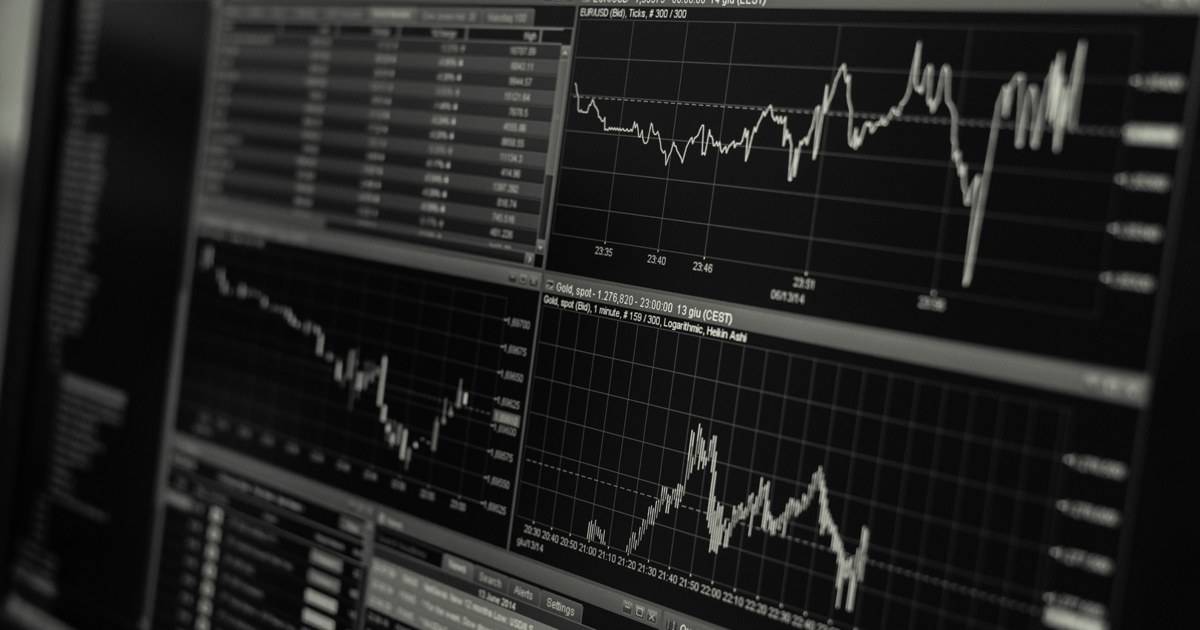
They are the price levels where, in the past, the market slowed down or turned around. The support sits below the current price: it is the point where declines have stopped, because enough buyers arrived there to slow them. The resistance sits above: it is the point where rises have stopped, because there the sellers took over.
The idea comes from the market's memory. Someone who bought at a certain price and then found themselves at a loss often waits to get back to even before leaving. Someone who missed an opportunity is still waiting for it. So some prices become meeting points, and the chart keeps a trace of them. It is not a law of physics, it is a behavior that repeats often, and not always.
You start from a and the on a timeframe long enough, for example the daily one, and you look for the points where the price turned more than once. The simplest method is this.
The more times a level has been touched, the more visible it is to other traders. Round numbers matter too, like 100 or 1,000, because many people place orders there. And volume matters: a level respected with many trades weighs more than one grazed almost in silence.
Because the price never respects a figure to the cent. It can go through a level by a little, pull back, then touch it again. If you draw a thin line, it will seem over and over that the level has been «broken», when the price was just oscillating around a band.
An illustrative example, with made up numbers. A price stops three times around 100, at 99.8, at 100.3 and at 100.1. The resistance is not «100», it is the band between 99.8 and 100.3. If the price then closes at 100.2 one day, nothing decisive has happened. If it closes steadily at 103 several times, the band has really been broken through.
When the price breaks through a resistance and stays above it, that level often changes role and becomes a support. The opposite holds too: a support broken to the downside tends to become a resistance. It is one of the oldest observations in technical analysis and you often see it on charts, but here too it is not a rule.
Then there is the false breakout: the price leaves the zone for a few hours, attracts those who enter «on the break», and then comes back in. That is why many wait for a close beyond the level, and not just a touch, and check whether the move comes with volume and new positions, as the guide onopen interest.
Here is their most concrete use, which is not about prediction but about risk management. Whoever opens a long can put the stop loss just below a support: if that level gives way, the starting idea no longer holds and it makes sense to exit. The take profit can sit just below a resistance, because that is where the price has already shown it struggles.
For a short it is the mirror image: the stop above a resistance, the target above a support. With a nearby level the stop stays short and the ratio between risk and reward is clearer, as the guide to theR unit. Leave a margin for error: put the stop a little beyond the level, not exactly on it, because the market likes to brush the points everyone is watching. And always check what it costs if it is hit, because with leverage a stop that is too wide may not sit before the liquidation.
There are three, and they are worth stating. The first is subjectivity: two people draw slightly different bands on the same chart, and neither is right in any absolute sense. The second is that a level is more reliable the more people watch it, but when everyone watches it the break can be violent. The third is that a support is not a promise: levels give way, especially when news arrives that changes the picture.
That is why they are used together with other information, such as market context, volume and timeframe, and never alone. A level tells you where the idea stops being valid, not where the price will go. If the numbers example feels abstract, there is a free way to try.
With practice, and without real money at first. On a demo account with real prices you can draw the bands, write down where you would put stop and target and check in the following days how many times the level held. After a month you have your own honest statistic on your drawings. The complete path, from the basics to the rules of caution, is in the guide to mindful online trading.
STA works on OKX derivatives: ten artificial intelligence agents analyze the markets twice a day, with a debate between a Bull and a Bear, and every card comes with its stop. Among the information the agents look at is the structure of the price, and every card states the level at which the idea stops being valid. You do not need to know how to draw a zone to read it, but understanding what it represents helps you see why the stop sits where it does. Your funds stay on your OKX account.
The DEMO is free forever, with real prices and the same cards as REAL. You need an account. During the launch phase, which began on 16 October 2026, STA's fees are temporarily disabled, even in REAL; the ordinary price list, suspended while the launch lasts, is 18% of the positive net result of each day, with no offsetting of losses. The history of the cards, losses included, is public on GitHub.
Every card as soon as it closes, with the result and what STA learned from it. It's free and you don't need to sign up.
Follow the channelA DEMO account with virtual capital and real prices, the same cards as REAL users.
Try DEMO for free →This article is for information only and is not investment advice. Trading crypto-assets involves a high risk, including the total loss of the capital used. Numerical examples are for illustration.
Candlestick chart: how to read it from scratch. Body, wicks, colors, timeframe and patterns like the doji, with their limits. Illustrative example.
Slippage trading: what price slippage is, why it happens and how to reduce it with limit orders and the right size. Illustrative example.
Maker and taker fees: what changes between a limit order and a market order, how they are calculated and why they weigh on your result. Illustrative example.
