 Giordano Salvatori, founder of STA · 10/11/2026 · 6 min read
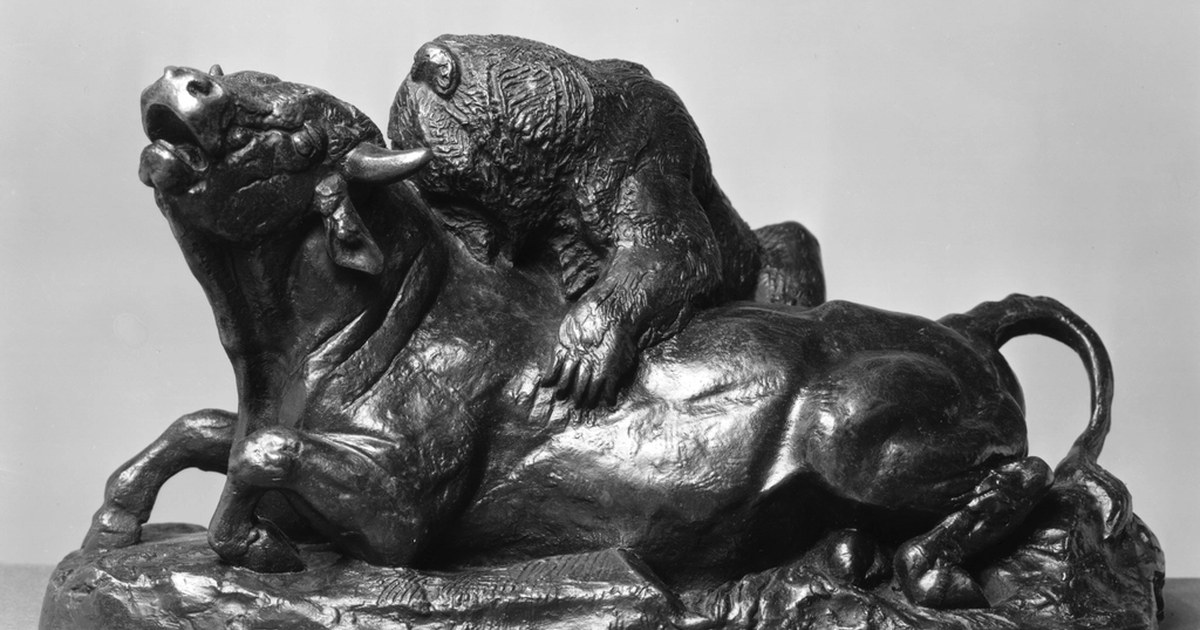
These are the two names the market world gives to the big phases of rise and fall. In a bull market (bull market, from the bull) prices rise for a long period and the general mood is confident. In a bear market (bear market, from the bear) prices fall for a long period and caution prevails, sometimes fear.
The image comes from the way the two animals attack: the bull strikes upward from below with its horns, the bear strikes downward from above with its paws. There is no authority that declares the start or the end of a phase: these are labels used by market participants, and that is why the boundaries are always a bit blurry.
It is the most widespread convention: we speak of a bear market when an index or a coin loses at least 20% from its recent high, and of a bull market when it rises at least 20% from its low. It is not a law, it is a convenient threshold people have agreed on, and it serves mainly to speak the same language.
An illustrative example, with made up numbers. A coin hits a high at 100. If it falls to 85 it is a correction, a 15% drop that often happens even inside rising phases. If it falls to 78 it has lost 22% and by convention we are in a bear market. To get back to 100 from 78, though, you need a gain of about 28%, because percentages don't add up: the guide on drawdown.
With a and the on a long timeframe, the daily or weekly one, you look for a few simple signals.
In cryptocurrencies, where moves are wider, the phases are also sharper. For example, bitcoin lost more than 70% from its peak at the end of 2021 to its low at the end of 2022, a bear market of a size rarely seen in many traditional markets.
The mirror image of the previous case: lower and lower highs and lows, rebounds that fade at a level lower than the last one, price below the long term average. On top of that comes a behavioral signal: positive news moves the price little, negative news moves it a lot. In derivatives it also shows in market numbers, for example in the funding rate and in theopen interest, which show how many people are betting on one side.
Watch out for rebounds. Inside a bear market there are rallies, even strong ones, sometimes 10 or 15% in a few weeks, that look like the start of a new rising phase and then fade. They are called bear market rallies and they have fooled many people: telling whether a rebound is a turning point or a pause is hard even for professionals.
No, and whoever promises it is telling a story. Phases are almost always recognized after the fact: you only know a high was a high once the price has fallen, and a low only once it has risen again. While they are under way, competent people disagree with each other, and often they are right in turn.
This is why markets should not be read as a forecast but as a context. Saying "we are in a bull market" describes what has happened so far, it doesn't say what will happen tomorrow. The same applies to any indicator: a piece of data is useful when it helps you decide how much to risk, not when you take it as a promise.
What changes most is the direction the wind blows. In a rising market, whoever opens a long moves with the current, in a falling market it is whoever opens a short who does. Trading against the phase is not forbidden, but it takes more caution, more disciplined stops and a smaller position size, as explained in the guide to position sizing.
The most common trap is a different one: arriving late. When a bull market is on the front pages, it is often already mature, and whoever jumps in for fear of being left out buys close to the highs. At the opposite end, in the middle of a bear market many sell in panic when the worst has already passed. They are two sides of the same emotional mistake, covered in the guide to trading psychology.
In a demo account with real prices you can open the daily chart of a coin, write down every week whether for you it is in a bull, a bear or a sideways phase, and note why. After a few months you compare your notes with what happened, and find out how often a reading "by eye" holds up. It is an exercise in humility more than technique, and it costs only the time you give it. The full path is in the guide to mindful online trading.
STA works on OKX derivatives: ten artificial intelligence agents analyze the markets twice a day and, before every card, set a Bull against a Bear. The Bull looks for the reasons why the idea can work, the Bear for those why it can fail, and the Research Manager weighs the debate. It is the same face off between bull and bear that this article is about, brought inside every analysis. Every card comes with its stop, and the funds stay in your OKX account.
The DEMO is free forever, with real prices and the same cards as REAL. You need an account. During the launch phase, which began on 16 October 2026, STA's fees are temporarily disabled, even in REAL; the ordinary price list, suspended while the launch lasts, is 18% of the positive net result of each day, with no offsetting of losses. The history of the cards, losses included, is public on GitHub.
Every card as soon as it closes, with the result and what STA learned from it. It's free and you don't need to sign up.
Follow the channelA DEMO account with virtual capital and real prices, the same cards as REAL users.
Try DEMO for free →This article is for information only and is not investment advice. Trading crypto-assets involves a high risk, including the total loss of the capital used. Numerical examples are for illustration.
Support and resistance explained from scratch: what they are, how to spot them, why they are zones and not lines, and how to use them with a stop. Illustrative example.
Candlestick chart: how to read it from scratch. Body, wicks, colors, timeframe and patterns like the doji, with their limits. Illustrative example.
Slippage trading: what price slippage is, why it happens and how to reduce it with limit orders and the right size. Illustrative example.
